I have written a perl script to install iraf under linux systems. It works fine for debian 7 (and should also work for ubuntu).
How use it:
1- Download it here
2- Enter the directory you download it: e.g. cd /tmp/
3- Run it: perl install_iraf.pl
4- Follow the instructions.
Tested on Debian 7- 64 bits.
Suggestions are welcome.
Wednesday, May 22, 2013
Wednesday, June 6, 2012
Sincronizando pastas e arquivos do PC do laboratório com o PC de casa
Se você está lendo esse post, provavelmente é um aluno usuário de computador do laboratório de astronomia, ou um computador do IF. Deve também ser do teu interesse sincronizar pastas e arquivos desse computador pra um computador de casa.
Para não precisar ficar atualizando pastas com o scp, onde tu tem que transferir arquivos que tu ja provavelmente tem dentro das pastas, o comando rsync é muito útil. Ele sincroniza pastas e seus arquivos internos mantendo arquivos idênticos e transferindo arquivos diferentes.
Bom, isso é uma maravilha, mas como vou fazer isso em PCs do IF, onde tenho que passar pela frontdoor? É simples.
Para passar pelo frontdoor, posso citar outro post, do Rogério (http://astro-stuff.blogspot.com.br/2008/11/ssh-sem-senha.html):
ssh -L 2000:nomedopc:22 frontdoor do if
onde tu substitui "nomedopc" pelo nome da máquina que tu quer acessar. Para logar no PC desejado, digite:
ssh usuário@localhost -p 2000
obviamente trocando "usuario" pelo seu nome de usuário. Agora pra sincronizar uma pasta do computador do Lab/IF com o computador de casa:
rsync -avhe 'ssh -p 2000' usuário@localhost:/pasta/ /pasta/
O rsync irá então atualizar as pastas, mantendo arquivos que são iguais (assim tu não vai ficar esperando transferencia desnecessaria) e transferindo arquivos diferentes. Pra fazer a transferência oposta, é so inverter o caminho no último comando.
OBS: Para instalar o rsync é só rodar:
sudo apt-get install rsync
Friday, April 20, 2012
Record stream media using mplayer
I really like a radio program that goes on air on a local radio. The radio is small, so they do not have a web site and podcasts even less. But they do have an online version of the radio broadcast.
Since the program goes live at 6am every day I always missed it (yes, I am not a morning type of person). To avoid such complications I wrote a simple bash script that calls mplayer to record the streaming radio at a given time of the day. The code goes like this:
#!/bin/bash LENGTH="65m" # lenght of the recording mplayer -quiet -dumpstream -dumpfile RECORDED.dump \ mms://So when I want to listen to the show I just use the unix "at" command to run this script at a given time. For instance:& echo $! >~/.mplayer-dumpstream.pid sleep $LENGTH && kill `cat ~/.mplayer-dumpstream.pid` rm ~/.mplayer-dumpstream.pid
# at -f script.sh -v 6am tomorrowThat is it. By the way, you can do that for video streaming as well. Enjoy
Wednesday, December 21, 2011
What operating systems do astronomers use?
Previously on AstroBetter, we’ve discussed what operating systems are used in our profession, in particular relative numbers of OS X (Mac) versus Linux users. While it’s good for us at AstroBetter to know our readership, we can use Google Analytics for that. It’s more important for the astronomical community to know the broader landscape, so that as astronomers develop software tools, they are aware of the platforms colleagues will use to access those tools.
So I asked the folks at STScI who run the Astronomer’s Proposal Tool (APT). They’ve been keeping track of what operating system was used to submit every Hubble proposal for the last 7 proposal cycles. They kindly sent me a chart to share. Here it is,
regraphicked for clarity. The Y axis is the percentage* of proposals per year submitted with a given operating system.

Each cycle had between 700 and 1100 proposals submitted. While there may be wavelength-dependent trends, I would argue that Hubble users are a broad cross-section into the astronomical community.
So this is a fascinating chart! Linux has slowly lost market share, and now serves a quarter of users. And check out the decline of Sun, and the corresponding rise of Macs. These are trends we all know — but it’s neat to see quantification.
Comments? Discussion?
* Ignore the small not-summing-to-100% problem; I digitized the charts from powerpoint figures, and didn’t click with fantastic precision.
Thursday, September 15, 2011
Removing pdf margins
Today I was working under ESO proposals and I would include two figure side by side, as esoform does not accept minipage I generate a pdf with the figures. But, then the problem start. It was necessary to remove the borders of the PDF file (figure I would insert). So I found the following text, at: http://www.mobileread.com/forums/showthread.php?t=25331
By using the first example I was able to remove the borders of my figures page.
*********
Many pdf files come for the printing, thus usually some large margins. But to read on Cybook you don't want margin, or do you? For me I just want as much space to display the text as possible.
I found one tool under linux. Very simple:
PDFCROP 1.5, 2004/06/24 - Copyright (c) 2002, 2004 by Heiko Oberdiek.
Syntax: pdfcrop [options] [output file]
Function: Margins are calculated and removed for each page in the file.
Options: (defaults)
--help print usage
--(no)verbose verbose printing (false)
--(no)debug debug informations (false)
--gscmd call of ghostscript (gs)
--pdftexcmd call of pdfTeX (pdftex)
--margins " " (0 0 0 0)
add extra margins, unit is bp. If only one number is
given, then it is used for all margins, in the case
of two numbers they are also used for right and bottom.
--(no)clip clipping support, if margins are set (false)
--(no)hires using `%%HiResBoundingBox' (false)
instead of `%%BoundingBox'
--papersize parameter for gs's -sPAPERSIZE=,
use only with older gs versions <7.32 ()
Examples:
pdfcrop --margins 10 input.pdf output.pdf
pdfcrop --margins '5 10 5 20' --clip input.pdf output.pdf
By using the first example I was able to remove the borders of my figures page.
*********
Many pdf files come for the printing, thus usually some large margins. But to read on Cybook you don't want margin, or do you? For me I just want as much space to display the text as possible.
I found one tool under linux. Very simple:
PDFCROP 1.5, 2004/06/24 - Copyright (c) 2002, 2004 by Heiko Oberdiek.
Syntax: pdfcrop [options]
Function: Margins are calculated and removed for each page in the file.
Options: (defaults)
--help print usage
--(no)verbose verbose printing (false)
--(no)debug debug informations (false)
--gscmd
--pdftexcmd
--margins "
add extra margins, unit is bp. If only one number is
given, then it is used for all margins, in the case
of two numbers they are also used for right and bottom.
--(no)clip clipping support, if margins are set (false)
--(no)hires using `%%HiResBoundingBox' (false)
instead of `%%BoundingBox'
--papersize
use only with older gs versions <7.32 ()
Examples:
pdfcrop --margins 10 input.pdf output.pdf
pdfcrop --margins '5 10 5 20' --clip input.pdf output.pdf
Sunday, September 4, 2011
See declared variables in python
For those using python for some time, you might miss some tricks that are present in many other script languages such as Perl and Bash.
One that I miss very much in dynamical naming of variables. You can easily overcome this problem using dictionaries:
But python names its variables by storing them on a global dictionary named vars(). So you can create a variable by naming it after a string
I don't know when one might need this, but it is doable.
One that I miss very much in dynamical naming of variables. You can easily overcome this problem using dictionaries:
d = {}

d['foo'] = 'bar'
But python names its variables by storing them on a global dictionary named vars(). So you can create a variable by naming it after a string
vars()['foo'] = 'bar'

print foo
I don't know when one might need this, but it is doable.
Tuesday, July 12, 2011
Ouvindo Rádios do ClicRBS no linux
Para quem curte as rádios do grupo RBS (Atlântida, Gaúcha, Itapema, etc..) ou mesmo quer ver os gols da dupla GreNal e isso (especialmente as rádios) não é possível no firefox do linux porque eles transmitem com o activeX. Descobri uma maneira de fazer isso.
Basta:
1 - No Firefox, clique com o botão direito sobre a imagem do vídeo e selecione a opção:
a) “Este frame” e logo em seguida “Código-fonte”
b) Caso não exista a opção “Este frame”, clique direto em “Código-fonte”.
2 – Busque pela palavra “played” (sem as aspas). Embaixo desta palavra você encontrará um link como no exemplo abaixo:
// Items to be played
urls[1] = ‘http://mediacenter.clicrbs.com.br/templates/GetAsx.aspx?contentID=36890&channelId=40‘;
titles[1] = ‘O dia dos candidatos na Capital’;
Basta copiar o link encontrado e tocá-lo no player, de preferência no totem, tive problemas com o mplayer.
Fonte:
http://josevitor.blog.br/tutorial-assistindo-videos-do-clicrbs-no-linux/
Friday, April 29, 2011
Removendo e/ou girando páginas de um arquivo PDF
Bom, precisei fazer isso uma vez não lembro o motivo...
segue um quase Ctrl-C/Ctrl-V de 'man pdftk'
Remove 'page 6' to 'page 8' from in.pdf to create out.pdf:
$ pdftk in.pdf cat 1-5 9-end output out.pdf
Remove only 'page 1':
$ pdftk in.pdf cat 2-end output out.pdf
Rotate the first PDF page to 90 degrees clockwise:
$ pdftk in.pdf cat 1E 2-end output out.pdf
Rotate an entire PDF document to 180 degrees:
$ pdftk in.pdf cat 1-endS output out.pdf
Thursday, April 14, 2011
Juntando vários arquivos PDF num único arquivo
Pessoal,
Uma dica para juntar arquivos pdf no linux:
Nota: tudo precisa estar na mesma linha.
Uma dica para juntar arquivos pdf no linux:
$ gs -q -dNOPAUSE -dBATCH -sDEVICE=pswrite -sOutputFile=saida.ps -f arq1.ps arq2.ps
$ gs -q -dNOPAUSE -dBATCH -sDEVICE=pdfwrite -sOutputFile=saida.pdf -f arq1.pdf arq2.pdf
$ gs -q -dNOPAUSE -dBATCH -sDEVICE=pdfwrite -sOutputFile=saida.pdf -f arq1.pdf arq2.pdf
Nota: tudo precisa estar na mesma linha.
Monday, April 11, 2011
Truques em Latex - Comentar trechos de texto
Você já se deparou com um parágrafo de texto que gostaria de comentar? e precisa colocar o % em todas as linhas?
Há uma maneira muito prática de fazer isso:
Primeiro:
Ative o pacote verbatim
Há uma maneira muito prática de fazer isso:
Primeiro:
Ative o pacote verbatim
\usepackage{verbatim} Depois é só fazer:
\begin{comment}
Este texto é legal.
Mas meu orientador não gostou.
Por isso tive que comentá-lo!
\end{comment}Viram, muito fácil.
Tuesday, September 28, 2010
Sherpa modeling and fitting package on Ubuntu
Sherpa is a set of fitting and modelling routines used by the people from the Chandra X-Ray Observatory. It is a very robust software with its own interface, although recently they developed a python implementation which is very easy to use. I guess x-ray astronomers must know what they are doing, don't you?
You can find the python package here.
When I tried to install it on Ubuntu 10.04 or 10.10 I faced a really nasty compilation problem with the file Simplex.cc. To fix it you must edit the following file before compiling:
Just add this line to the beginning
If you have all dependencies installed the compilation should run just fine. In the following weeks I will post some examples with Sherpa.
You can find the python package here.
When I tried to install it on Ubuntu 10.04 or 10.10 I faced a really nasty compilation problem with the file Simplex.cc. To fix it you must edit the following file before compiling:
sherpa-4.2.2/sherpa/optmethods/Simplex.cc
Just add this line to the beginning
#include <stdio.h>
If you have all dependencies installed the compilation should run just fine. In the following weeks I will post some examples with Sherpa.
Wednesday, September 22, 2010
Python: how to start learning?
Many (most?) people that want to start learning Python are confused about where to start. So many options! Motivated by this, I list in this post the references that I used to learn Python (and object-oriented programming as well), which can serve as a starting point for other people. I had scientists in mind when I wrote this post.
Beginner material
Learned the basic syntax and capabilities of the language with the official Python tutorial. You can download all of this as PDF files. I suggest this for people with previous programming experience. For absolute beginners, have a look at the Think Python book below.
Computação científica com Python, Fabrício Ferrari (portuguese only)
Introductory lecture about Python, its syntax and science applications. It shows what Python is capable of for data analysis and plotting. Inspiring. The audio is also available for download as a MP3 file.
Tutorial on using Python for data analysis! How to on how to replace IDL/Matlab with Python, essentially. Includes: plotting, FITS files, signal processing.
I learned object-oriented programming using this material. Very clear and "application-oriented" approach. You don't need to be a biologist to understand this.
Longer introduction for people with no previous extensive programming experience.
Quick reference
Migrating from IDL/Matlab to Python.
If you are going to do serious stuff with Python, I suggest using the enhanced interactive Python terminal IPython.
Longer introductory books
Learning Python, Mark Lutz
A primer on scientific programming with Python, Hans Petter Langtangen
Longer reference books
Python essential reference, David Beazley
Wednesday, September 15, 2010
Switching from Windows/PC to Mac
OK, you got your shiny new Mac machine and switched from Windows to Mac OS X. What now? It happens that a friend of mine is going through that process and I assembled a list of links which might be useful for Mac newbies, which you can find below.
Switching from windows to mac, several tips and advice.
Several video tutorials made by Apple. Quick and simple.
My collection of mac-related links. Be sure to check out the following links:
- AlternativeTo.net: find alternative free software to commercial ones
- Mac OS X for scientists: Mac tutorial for scientists
- Best Mac software
Advice on your first Mac.
Friday, July 2, 2010
Assessoria Estatística na UFRGS
Durante o nosso trabalho muitas vezes precisamos realizar um tratamento estatístico cuidadoso dos dados para atingir determinados objetivos científicos. Quando trabalhamos com dados astronômicos, surge uma vasta gama de problemas estatísticos: desde regressões lineares até tópicos mais esotéricos como estatística espacial, estatística bayesiana, bootstrapping etc etc (já ouviram falar na astroestatística?).
Infelizmente, muitas vezes falta aos astrônomos o background estatístico necessário para entender os métodos e aplicá-los corretamente! Isto tem levado a algumas iniciativas para melhorar a formação estatística dos astrônomos, por exemplo: INPE Advanced Course on Astrostatistics, Summer School in Statistics for Astronomers.
Recentemente, fiquei sabendo de uma iniciativa muito legal que existe aqui na UFRGS, através do Ângelo. É o Núcleo de Assessoria Estatística (NAE) do Instituto de Matemática. Este núcleo é composto por um grupo de estatísticos que prestam assessoria para a comunidade. Eis uma lista das áreas da estatística abrangidas pelo NAE.
Como funciona o NAE
Suponha que você tenha dúvidas sobre qual o melhor tratamento estatístico que deve ser usado nos seus dados. Ou talvez você já saiba qual técnica estatística empregar mas gostaria de entender melhor o método e sua aplicabilidade. Você pode se dirigir ao NAE ou ligar pra
eles pra agendar uma consulta. Os estatísticos vão analisar o seu problema e lhe prestar a assessoria apropriada.
É cobrada dos alunos de PG a taxa de R$ 30 para a assessoria (é cobrada uma só vez). Em vista dos possíveis insights estatísticos que você pode ter para explorar melhor os seus dados, facilitar o seu trabalho e mesmo poupar tempo, isto me parece um custo irrisório. Há alguns meses tive que me aventurar numa técnica estatística sobre a qual tinha pouco conhecimento, e certamente o NAE teria me ajudado. Infelizmente não o conhecia na época...
Enfim, fica a dica pra vocês!
NAE - Núcleo de Assessoria Estatística
Monday, June 21, 2010
New STSCI Python package (2.10)
Those who updated Ubuntu from version 9.10 (Karmic Koala) to 10.04 (Lucid Lynx) might have noticed that Python 2.5 is not available in the new default repository. This is a big issue for the users such as the users of the Space Telescope Science Institute Python packages (PyRAF, MultiDrizzle, etc...) or some older google engine apps.
Fortunately a new version of the stsci_python is out today! With full support to Python 2.6 (3.0 will take longer).
http://www.stsci.edu/resources/software_hardware/pyraf/stsci_python/current/download
Update (21/06)
Some may have the following error when importing the iraf modules using
To fix it the trailing slash on the /iraf/iraf/unix/hlib/zzsetenv file on line 38 should be removed. Everything runs smoothly.
Fortunately a new version of the stsci_python is out today! With full support to Python 2.6 (3.0 will take longer).
http://www.stsci.edu/resources/software_hardware/pyraf/stsci_python/current/download
Update (21/06)
Some may have the following error when importing the iraf modules using
from pyraf import iraf
  File "", line 38
    iraf.set(as = 'host$as/')
              ^
SyntaxError: invalid syntax
/usr/local/lib/python2.6/dist-packages/pyraf/irafimport.py:54: RuntimeWarning: Parent module 'pyraf' not found while handling absolute import
  return _originalImport(name, globals, locals, fromlist, level)
To fix it the trailing slash on the /iraf/iraf/unix/hlib/zzsetenv file on line 38 should be removed. Everything runs smoothly.
Saturday, June 19, 2010
Practical spell checker: aspell
aspell is a practical spell checker available for Linux and Mac OS X. It is installed by default on most linux distros. You can get it in mac using MacPorts/Fink. aspell goes through your document, asking to replace words that it suspects are wrong.
I used it a few days ago to spell check a paper of mine before submitting. It has different modes, for instance a TeX mode. Here is how you call it to spell check a latex document written in english:
aspell check -l en --mode tex paper.tex
How to spell check a document in brazilian portuguese:
aspell check -l pt_br test.txt
Try it, it is very easy to use.
Friday, June 18, 2010
Google CL is amazing
This post was done using only the *NIX command line using the googlecl (http://code.google.com/p/googlecl/) tool. Try it
Wednesday, June 2, 2010
Vim tricks for Python programmers
Hi there, as many of my friends know I am a Vi enthusiast. The truth is that I am just faster using Vi than using the mouse in any graphical editor. I know many of *NIX users would agree with me when it comes to command line vs. clicking.
This post is for Vi users that may find frustrating programming Python without a mouse cursor to help on indentation and block selection. The tricks are to set these environmental variables on Vi:
So if you put this on your ~/.vimrc you should get a Vi that is Python friendly every time you edit a *.py file.
Essentially these options will make tabs become 4 spaces and add auto-indentation after keywords of python (if, while, do, try, etc...). For more info on each command type on Vi ':help'
Have fun!
This post is for Vi users that may find frustrating programming Python without a mouse cursor to help on indentation and block selection. The tricks are to set these environmental variables on Vi:
autocmd BufRead *.py \
set expandtab \
set tabstop=4 \
set shiftwidth=4 \
set smarttab \
set softtabstop=4 \
set autoindent \
set textwidth=110
autocmd BufRead *.py set smartindent \
inwords=if,elif,else,for,while,try,except,finally,def,class
So if you put this on your ~/.vimrc you should get a Vi that is Python friendly every time you edit a *.py file.
Essentially these options will make tabs become 4 spaces and add auto-indentation after keywords of python (if, while, do, try, etc...). For more info on each command type on Vi ':help
Have fun!
Monday, May 17, 2010
Visto EUA em SP: Algumas dicas
Acabei de voltar de São Paulo, onde fui pra tirar um visto acadêmico pros Estados Unidos. Gostaria de compartilhar algumas dicas que podem ser úteis pra quem for passar pelo mesmo processo.
Hospedagem: Eu recomendo o hotel Intercity Nações Unidas, que até onde eu sei é o mais barato nas proximidades do consulado. A estadia no fim de semana é mais barata. Eu paguei uma diária de R$ 155 (mais taxas) ficando de Domingo para Segunda-feira (minha entrevista de visto foi na Segunda). Tem um ponto de táxi na frente do hotel. Para a janta, há uns restaurantes acessíveis na Fernandes Moreira (a rua do hotel). Não recomendo a comida do hotel, que é extremamente cara e não vale o preço.
Caixas eletrônicos: Vá com dinheiro para o consulado para pagar as taxas consulares e sedex, que vão dar mais de cem reais dependendo do visto. Se você precisar de caixa eletrônico, há vários deles no Carrefour da Rua Alexandre Dumas, a cerca de duas quadras do Intercity. Tem caixa eletrônico do Banco do Brasil, Santander, Unibanco etc.
Celular, Ipod etc no consulado: Nenhum eletrônico é permitido dentro do consulado, e eles não têm mais guarda-volumes dentro do consulado. Portanto, ou não leve eletrônicos na entrevista, ou deixe as suas coisas em um dos guarda-volumes que existem na frente do consulado por sua conta e risco (foi o que eu acabei fazendo).
DS-160: O sistema de preenchimento de informações para visto mudou, e agora é tudo online, através do formulário DS-160. Eu tive uma experiência ruim com este sistema: a cada 20 minutos/meia hora o sistema me desconectava, e todas as informações que eu tinha digitado eram perdidas. A solução é a cada 20 minutos salvar um arquivo com as informações do formulário, que pode ser importado caso você seja desconectado. É dose, eu sei. Outra: você vai levar no mínimo uma hora preenchendo este formulário.
Sunday, April 18, 2010
Seminários de AstroProgramação
Ás vezes queremos aprender novas linguagens de programação, mas pela falta de tempo acabamos não conseguindo. Para acelerar o processo de aprendizado, está acontecendo no Departamento de Astronomia da UFRGS os Seminários de AstroProgramação: uma série de palestras informais, cada uma devotada a uma linguagem de programação diferente, com foco nos astrônomos.
A proposta é que a cada semana, um voluntário dê uma palestra a respeito das virtudes da linguagem de programação de sua escolha. Cada palestra deve apresentar um exemplo simples de programa (tipo "hello world"), bem como alguns códigos-fontes um pouco mais sofisticados que demonstrem a sintaxe básica etc. A duração das palestras é semelhante a de um seminário de grupo.
As linguagens abordadas foram: IDL, Perl, Python, C, Fortran 90, PHP, programação orientada a objetos com C++, paralelização (MPI) e Tcl/Tk.
Os slides apresentados nas palestras, bem como material adicional (códigos-fontes etc) estão disponíveis nesta página.
Changelog:
- 23 Abr 2010: adicionei Tcl/Tk à lista.
- 11 Jul 2010: removi OpenMP da lista.
Tuesday, March 23, 2010
Useful Mac OS X tools for scientists/astronomers
Here are some of my preferred tools when doing science using Mac OS X. I previously had a PC laptop with Linux (Ubuntu) and Windows (Vista) and made a very smooth transition to Mac OS X. I found replacements for all the tools that I used before. Disclaimer: I am an astrophysicist, so the software listed here is biased in that respect.
You can find more resources in my delicious list of mac+astronomy links, including where to get IRAF for example.
TeX Live
Quicksilver
You can find more resources in my delicious list of mac+astronomy links, including where to get IRAF for example.
TeX Live
LaTeX distribution
TeXshop
TeXshop
LaTeX editor (comes with TeX Live)
LaTeXit
LaTeXit
Equation editor (comes with TeX Live)
Uses LaTeX for creating equations that can be exported as PDF, PNG. Equations can be dragged and dropped in other applications. Unfortunately the drag and drop does not work with OpenOffice.
TextWrangler
Uses LaTeX for creating equations that can be exported as PDF, PNG. Equations can be dragged and dropped in other applications. Unfortunately the drag and drop does not work with OpenOffice.
TextWrangler
Useful for editing source code in different programming languages and codifications.
MacPorts
MacPorts
Package of command-line open source software (like Fink), which is an updated version of DarwinPorts. Need Python, gawk, wget, aspell? Use Macports. The functionality is quite similar to Debian's apt-get for installing software. port search [software] searches for available software. sudo port install [software] downloads, compiles and install new software and its dependencies for your architecture.
Quicksilver
Quick way of launching applications. Press Ctrl+Spacebar and type the first few letters of the application you want to launch.
Spotlight
The builtin Spotlight (Cmd+Spacebar) is very handy when searching for papers/documents scattered through your HD. Functionality similar to Google Desktop.
Dropbox
Quite handy way to sync files between home and work. It creates a dropbox folder in your home. Each file you drop there is automatically synced over the internet in all the computers where you installed dropbox. Join it via this link and you will get more space than usual (and I will get a little bonus).
iWork's Keynote: For talks
I had been using OpenOffice Impress for a long time to prepare talks, but gave up on it. Reasons:
Synkron
Sync files between folders locally.
KeePassX
Cross-platform password databases. Work with a master password.
Inkscape
Work with illustrations, edit PDF files. It's a "free version" of Adobe Illustrator. Allows you to edit the figures in a PDF paper, for example, and export them to a talk.
Wine
To run windows programs. You can install it using MacPorts.
Other suggestions
Picasa
I personally prefer Picasa over iPhoto, but that's of course a matter of taste.
Adium
IM client which supports tons of networks, including MSN, Google Talk, AIM etc. Mac's version of Pidgin.
Spotlight
The builtin Spotlight (Cmd+Spacebar) is very handy when searching for papers/documents scattered through your HD. Functionality similar to Google Desktop.
Dropbox
Quite handy way to sync files between home and work. It creates a dropbox folder in your home. Each file you drop there is automatically synced over the internet in all the computers where you installed dropbox. Join it via this link and you will get more space than usual (and I will get a little bonus).
iWork's Keynote: For talks
I had been using OpenOffice Impress for a long time to prepare talks, but gave up on it. Reasons:
- Unstable when editing large presentations containing lots of slides/plots. Crashes commonly in linux/mac.
- Talks do not maintain their structure when you open them in different platforms (e.g., creates the talk in linux, then opens in mac).
- Gets slower as the size of the presentation increases. Especially slow in Mac.
Synkron
Sync files between folders locally.
KeePassX
Cross-platform password databases. Work with a master password.
Inkscape
Work with illustrations, edit PDF files. It's a "free version" of Adobe Illustrator. Allows you to edit the figures in a PDF paper, for example, and export them to a talk.
Wine
To run windows programs. You can install it using MacPorts.
Other suggestions
Picasa
I personally prefer Picasa over iPhoto, but that's of course a matter of taste.
Adium
IM client which supports tons of networks, including MSN, Google Talk, AIM etc. Mac's version of Pidgin.
VirtualBox
Virtualization software, i.e. you can use this to run Windows XP or Ubuntu in a separate windows.
Changelog:
Changelog:
- Apr 21 2010: Added textwrangler to the list.
Monday, March 8, 2010
Select fits files based on header keyword
The task of selecting a list of fits files based on some header keyword value is much easier to do with the IRAF task hselect. Although this example is very useful for understanding how to use pyfits and the sys module for passing parameters via command line (like bash our Perl's @ARGV).
To execute just run on the command line:
or
All bash's wildcards (*, ?, etc) are accepted.
#!/usr/bin/python

import sys
import pyfits
import re

for file in sys.argv[1:]:  #exclude the first element of sys.argv
     hdulist = pyfits.open(file)  #open fits
     key = hdulist[1].header['OBJECT'] #reads a keyword from the fits header
     if (re.search('standard',key)):  #search the keyword value for some string
             print file
To execute just run on the command line:
# python script.py file1 file2 ...
or
# chmod +x script.py
# ./script.py file1 file2 ...
All bash's wildcards (*, ?, etc) are accepted.
Wednesday, March 3, 2010
How to know how many slots of memory are used (or free)?
My last linux trouble was to discover how many memory slots were free in my CPU without opening it.
The solution to this problem comes from Lamarque Souza:
all you need is to run dmidecode | grep -A 8 'Memory' as root, or on ubuntu:
sudo dmidecode | grep -A 8 'Memory'
Note: For more information remove the -A 8 from the grep command.
If it works correctly you should get something like the below. What you can see is that there are 4 slots for memory, and 2 of them have memory installed ( look at: Memory Device).
Physical Memory Array
Location: System Board Or Motherboard
Use: System Memory
Error Correction Type: None
Maximum Capacity: 8 GB
Error Information Handle: Not Provided
Number Of Devices: 4
Handle 0x0015, DMI type 19, 15 bytes
Memory Array Mapped Address
Starting Address: 0x00000000000
Ending Address: 0x000FFFFFFFF
Range Size: 4 GB
Physical Array Handle: 0x0014
Partition Width: 0
Handle 0x0016, DMI type 17, 27 bytes
Memory Device
Array Handle: 0x0014
Error Information Handle: Not Provided
Total Width: 64 bits
Data Width: 64 bits
Size: 2048 MB
Form Factor: DIMM
Set: None
Locator: J1MY
--
Memory Device
Array Handle: 0x0014
Error Information Handle: Not Provided
Total Width: 64 bits
Data Width: 64 bits
Size: 2048 MB
Form Factor: DIMM
Set: None
Locator: J2MY
--
Memory Device
Array Handle: 0x0014
Error Information Handle: Not Provided
Total Width: Unknown
Data Width: Unknown
Size: No Module Installed
Form Factor: DIMM
Set: None
Locator: J3MY
--
Memory Device
Array Handle: 0x0014
Error Information Handle: Not Provided
Total Width: Unknown
Data Width: Unknown
Size: No Module Installed
Form Factor: DIMM
Set: None
Locator: J4MY
Friday, February 26, 2010
Inkscape: powerful tool to edit plots and PDF files
The free graphics editor Inkscape is a powerful PDF editor. It can be used to change / enhance figures embedded in PDF documents, without the need of having the source data using to produce the plot.
Suppose there is a given plot in a paper and you want to use it in a talk or another document. Suppose that you would like to change the color of a line, or make the points thicker etc. That is easy with Inkscape. If the plot was embedded in the PDF including vectorial data, then you can change all its properties by opening the PDF file in Inkscape, making the changes (the interface is intuitive) and then exporting it as a PDF, PNG etc.
Inkscape is available for Mac OS X, Linux and Windows.
New colors in SM
I like to use Super Mongo to make my plots. It is a very nice software, but somethings are, some times, hard to do (or hard to find in the tutorial). My last 3 problems were related to:
a) Log scales in SM.
All what you need to do is:
: ticksize -1 0 -1 0
: box
Note: you need to work with the data in log, what you can do by:
: read {f1 1}
: set f1=lg(f1)
b) Add grid lines in the plot.
: box grid 1 (to small and long grid lines) or 0 (for only long grid).
c) The last one was in trying to add more colors to SM color pallet.
To solve this issue I found Annika Peter page, which I resume below.
Note: The figures were taken from Annika Peter page.
The problem: There are only seven "default" colors in SM.

But is very easy to add more colors to SM color pallet.
i) use the command "add_ctype"

I hope this will help you.
a) Log scales in SM.
All what you need to do is:
: ticksize -1 0 -1 0
: box
Note: you need to work with the data in log, what you can do by:
: read {f1 1}
: set f1=lg(f1)
b) Add grid lines in the plot.
: box grid 1 (to small and long grid lines) or 0 (for only long grid).
c) The last one was in trying to add more colors to SM color pallet.
To solve this issue I found Annika Peter page, which I resume below.
Note: The figures were taken from Annika Peter page.
The problem: There are only seven "default" colors in SM.

But is very easy to add more colors to SM color pallet.
i) use the command "add_ctype"
: add_ctype mycolor 170 170 0
This will produce darkgold
A very nice tool to help here is the http://www.colorschemer.com/online.html web site.
A very nice tool to help here is the http://www.colorschemer.com/online.html web site.
ii) Use the : xtcolors to add new colors. This will produce the following colors.

I hope this will help you.
Friday, February 19, 2010
Suggested reading: The trouble with physics by Lee Smolin
 I just devoured this book on my trip to Chile last week. The author, Lee Smolin, gives a very clear description off the main revolutions in physics and explain why and how does the string theory fails as a theory by itself. There are great examples explaining how the great scientist, such as Galileo, Kepler, and Einstein got theirs insights and played important roles in modern science.
This is a book for the layman, although a little bit of basic physics helps to see the big picture more clearly. I recommend it for everyone that is starting a career on physics/astronomy (at least it helped me a lot!).
Monday, February 1, 2010
Using f2py
The purpose of the F2PY --Fortran to Python interface generator-- is to provide connection between Python and Fortran languages. Here I will show a simple example of how to use this tool and compare the its efficiency against a pure python code.
First, lets write our fortran routine:
This code simply calculate the distance to the origin of a bunch of points. The input is two vectors with identical dimension n. Note that you must specify what goes in and what goes out to the f2py parser, this is done by using the a comment line followed by f2py:
Now lets compile and link it to python using:
Unfortunately f2py does not easily support the Intel Fortran Compiler (ifort), although gfortran does a good job on most of the cases.
It ridiculously easy to call this routine inside python. The script bellow call the fortran routine and then compares its execution time with an identical pure python routine plus the same done using Numpy.
If everything goes OK the result should be something like this:
The advantages of using f2py are obvious, the runtime of the pure python code is almost 500 times greater! When using numpy to handle the arrays we get a much better execution time, but still slower when compared to fortran.
I hope this post was useful to the people thinking of migrating to python in the near future.
First, lets write our fortran routine:
        Subroutine test(a,b,n,c)

        Implicit none
        Integer::i
        Integer, intent(in)::n
        Real, dimension(n), intent(in)::a,b
        Real, dimension(n), intent(out)::c
!f2py   depend(n)::a,b,c
!f2py   intent(in)::a,b
!f2py   intent(out)::c

        Do i=1,n
          c(i) = sqrt(a(i)**2.0 + b(i)**2.0)
        EndDo

        End subroutine test
This code simply calculate the distance to the origin of a bunch of points. The input is two vectors with identical dimension n. Note that you must specify what goes in and what goes out to the f2py parser, this is done by using the a comment line followed by f2py:
!f2py   depend(n)::a,b,c
!f2py   intent(in)::a,b
!f2py   intent(out)::c
Now lets compile and link it to python using:
f2py -m func -h func.pyf func.f --overwrite-signature
f2py --fcompiler=gfortran -c func.pyf func.f
Unfortunately f2py does not easily support the Intel Fortran Compiler (ifort), although gfortran does a good job on most of the cases.
It ridiculously easy to call this routine inside python. The script bellow call the fortran routine and then compares its execution time with an identical pure python routine plus the same done using Numpy.
#!/usr/bin/python
import numpy as np
import time
import func

n = 10000
#generates a normal distribution with n points
x = np.random.randn(n)
y = np.random.randn(n)

# Using the fortran routine
t1 = time.time()
f = func.test(x,y,n)
t2 = time.time()

t = (t2-t1)*1000

print 'Fortran runtime (ms): ',t

# Using pure python
t1 = time.time()
r = np.zeros(n)
for i in range(n):
 r[i] = np.sqrt(x[i]**2 + y[i]**2)
t2 = time.time()

t = (t2-t1)*1000

print 'Python runtime (ms): ',t

# Using pure python
t1 = time.time()
r = np.sqrt(x**2 + y**2)
t2 = time.time()
t = (t2-t1)*1000

print 'Python + numpy runtime (ms): ',t
If everything goes OK the result should be something like this:
Fortran runtime (ms):  0.150918960571
Python runtime (ms):  76.4260292053
Python + numpy runtime (ms):  0.485181808472
The advantages of using f2py are obvious, the runtime of the pure python code is almost 500 times greater! When using numpy to handle the arrays we get a much better execution time, but still slower when compared to fortran.
I hope this post was useful to the people thinking of migrating to python in the near future.
Sunday, January 31, 2010
Dropbox: online folder to easily sync your data across different computers
Like many users, I regularly use more than one computer: one at home (a Mac) and one at work (Linux workstation). This kind of situation creates some challenges regarding how to keep your data synchronized between the different computers/operating systems.
That's where the free online service Dropbox comes handy. It creates a local folder called Dropbox in your "home". Everything that you dump in that folder is automatically synced with the online folder, and immediately made available to all your computers. You just need to install a dropbox client in each computer, and that's it. Thanks to Dropbox, I almost don't need to use USB flash drives anymore to sync data between different computers. Sweet!
Dropbox has a cool feature: it lets you share a folder among a group of people. Let me give an example of how that can be useful. Suppose you have coworkers/collaborators and you are working together on some code, paper or data. Suppose that you are constantly updating your code/paper/data and your collaborator wants to always have the latest version of it. When you share a dropbox folder with your collaborators, every change that you or your coworker make to any file in that folder is automatically made available to all the people sharing the folder. See how the sharing feature can be useful?
Dropbox gives you a free 2 GB account. For paid accounts, they provide more space (up to 100 GB).
Link to join Dropbox (includes a tour of the features).
Changelog:
- May 31 2010: Added "sharing" feature.
Saturday, January 30, 2010
Syntax Highlight
Testando os scripts de syntax highlight do blogger
Funciona! Então, pra usar é só só escrever o código entre as tags PRE usando os modificadores name='code' e class='linguagem'. Por enquanto linguagem pode ser: C, C#, CSS, Bash, Java, JavaScript, Perl, PHP, Python, Ruby e Sql
Qualquer dúvida dá uma espiada no código fonte desse post.
Ah sim, o script ali é para converter qualquer formato em qualquer formato todos os arquivos de um diretório. Usa o comando a2ping e transforma, nesse caso, qualquer formato para png (Portable network graphs).
#!/bin/bash
# converte qq formato para qq formato (muhahahaha!)

for file in $1/*
do
    ext=$(echo $file | sed 's/.*\([^\.]\+\)\.\([^\.]\+\)$/\2/')
    name=$(basename $file .$ext) #elimina $ext do nome
    a2ping $file png:$name.png --nocompress --papersize=unchanged

done
Funciona! Então, pra usar é só só escrever o código entre as tags PRE usando os modificadores name='code' e class='linguagem'. Por enquanto linguagem pode ser: C, C#, CSS, Bash, Java, JavaScript, Perl, PHP, Python, Ruby e Sql
Qualquer dúvida dá uma espiada no código fonte desse post.
Ah sim, o script ali é para converter qualquer formato em qualquer formato todos os arquivos de um diretório. Usa o comando a2ping e transforma, nesse caso, qualquer formato para png (Portable network graphs).
Thursday, January 28, 2010
Vim Tip: como comentar multiplas linhas?
Isso é muito útil na hora de mascarar um bloco de código comentando-o.
Para fazer isso basta entrar no modo visual do vi (CTRL + I) na primeira linha que deseja comentar. Vá até a ultima linha que deseja comentar e aperte I (Letra I maiúscula; insere no começo da linha) e insira o caractere de comentário (#: python,bash ; !: fortran; %: latex ...) e em seguida aperte ESC para sair do modo visual.
Simples, não? X é para os fracos.
Obs.: Para descomentar, no modo visual selecione a primeira coluna e aperte x.
Wednesday, January 27, 2010
Mais Python?
Só pra mostrar que eu faço alguma coisa da vida, ai vai mais um post com um tutorial em python.
Agora vou mostrar como interagir com gráficos. Isso na verdade é bastante complicado, requer um entendimento forte de orientação a objetos(OO). Nesse exemplo eu tentei evitar OO, justamente porque não estou tão familiarizado com isso.
A proposta é: dado um conjunto de pontos como selecionar somente aqueles dentro de um polígono definido pelo usuário interagindo com o gráfico? A solução é o seguinte a seguir. Como de costume, precisa o NumPy, MatPlotLib e PyLab.
O programa funciona da seguinte maneira. Enquanto você vai com o mouse no ponto onde quer definir um dos vértices do polígono e aperta alguma tecla do teclado que não seja a tecla 'q', um ponto será marcado. Ao apertar 'q' você sai do programa e os pontos dentro do polígono são marcados pela cor vermelha.
Felizmente, nesse exemplo não precisa baixar nada. Basta copiar, colar e rodar. Ah sim, o highlight da sintaxe python foi feito nesse site.
Ia escrever outro post sobre um resolvedor de simulação 3 corpos em python, mas já ta no meu site e eu cansei do blogspot, queria mesmo é o wordpress. Nesse exemplo tem até instruções pra criar uma animação.
PS.: caiu fora do post as linhas muito longas, não to com saco pra arrumar agora
Agora vou mostrar como interagir com gráficos. Isso na verdade é bastante complicado, requer um entendimento forte de orientação a objetos(OO). Nesse exemplo eu tentei evitar OO, justamente porque não estou tão familiarizado com isso.
A proposta é: dado um conjunto de pontos como selecionar somente aqueles dentro de um polígono definido pelo usuário interagindo com o gráfico? A solução é o seguinte a seguir. Como de costume, precisa o NumPy, MatPlotLib e PyLab.
O programa funciona da seguinte maneira. Enquanto você vai com o mouse no ponto onde quer definir um dos vértices do polígono e aperta alguma tecla do teclado que não seja a tecla 'q', um ponto será marcado. Ao apertar 'q' você sai do programa e os pontos dentro do polígono são marcados pela cor vermelha.
#!/usr/bin/python
from pylab import *
import numpy as np
import matplotlib.nxutils as nx

poly=np.zeros([100,2]) #limits the number of vertices to 100 (how to ovecome this?)
i = int(0)             #not very python-ish
x = np.random.rand(1000)
y = np.random.rand(1000)
f = np.array([x,y])
f = np.transpose(f)

def click(event):
    global poly,f,i,g
    tb = get_current_fig_manager().toolbar
    if event.key != 'q' and event.inaxes and tb.mode == '':
      poly[i,0],poly[i,1] = event.xdata,event.ydata
      plot(poly[0:i+1,0],poly[0:i+1,1],'rs-')
      draw()
      i += 1
    else:
      poly[i,0],poly[i,1] = poly[0,0],poly[0,1]
      poly = np.resize(poly,(i+1,2))
      inside = nx.points_inside_poly(f[:,0:2], poly)
      g = f[nonzero(inside),]   #this adds an extra dimension to the array (why?!)
      plot(g[:,:,0],g[:,:,1],'r.',markersize=6)
      return g

fig = figure()
ax = fig.add_subplot(111,autoscale_on=True)
ax.plot(f[:,0],f[:,1],'k.',markersize=4)

#connects python with the display
cid = connect('key_press_event', click)
show()
disconnect(cid)
Felizmente, nesse exemplo não precisa baixar nada. Basta copiar, colar e rodar. Ah sim, o highlight da sintaxe python foi feito nesse site.
Ia escrever outro post sobre um resolvedor de simulação 3 corpos em python, mas já ta no meu site e eu cansei do blogspot, queria mesmo é o wordpress. Nesse exemplo tem até instruções pra criar uma animação.
PS.: caiu fora do post as linhas muito longas, não to com saco pra arrumar agora
Python \o/
Então, nas ultimas semanas estive envolvido com Python bastante. O motivo disso é que o Dark Energy Survey (DES) adota o python como sua linguagem de frontend. Como eu faço parte do grupo de populações estelares do DES fui obrigado a lidar com Python em diversos níveis. Então vou explicar uma das coisas que tive que desenvolver nesse projeto.
O objetivo desse tuturial é gerar uma carta do céu e identificar certas estrelas nesta carta. O propósito é o planejamento de uma observação astronômica, nesse caso do aglomerado globular NGC 2298. Com essa carta o observador vai saber se o telescópio está apontando na direção que deveria estar apontando. O campo é uma simulação do campo de visão do instrumento MOSAIC2 do telescópio Blanco de 4m.
Bom, vamos ao Python... Para rodar esse programa você vai precisar dos módulos NumPy e PyLab, ambos disponíveis através do repositório Debian/Ubuntu e do módulo APLpy que deve ser instalado manualmente. Além disso para rodar você precisa baixar e descompactar os arquivos específicos para esse problema aqui.
O produto final, se tudo der certo, deve ser algo do tipo:
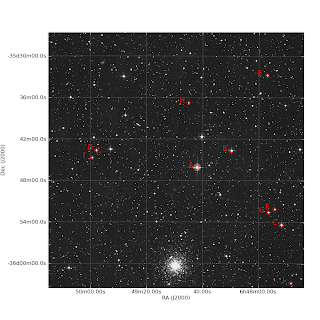

#!/usr/bin/python
from pylab import *
import aplpy
import numpy as np

Alphabet = map(chr, range(65, 91))   # Capitalized alphabet

fig = figure(figsize=(10,10))
gc = aplpy.FITSFigure('field.fits',figure=fig, subplot=[0.15,0.1,0.8,0.8])
gc.show_grayscale()
gc.show_grid()
gc.set_grid_alpha(0.2)

# read and plot the GSC stars
f = np.loadtxt('gsc.dat')
ra,dec = f[:,0],f[:,1]
gc.show_markers(ra,dec,edgecolor='red',marker='o',s=50)

#this convert from world coordinates to pixel (canvas) coordinates
newra,newdec = gc.world2pixel(ra+0.025,dec)

#place a tag near each marked point in the image
for i in range(f.shape[0]):
  text(newra[i],newdec[i],Alphabet[i],fontsize=16,color='red')

#save as png
gc.save('findingchart.png')
Monday, January 18, 2010
Easy ways of adding math/greek in your IDL plots
It's not straightforward to add greek letters, math etc in IDL plots. Fortunately, there are some libraries that make our life easier for this purpose:
TeXtoIDL
The purpose of the TeXtoIDL routines is to make it simple to use Greek letters, subscripts and superscripts in making labels for plots in IDL. This is accomplished by allowing the user to use TeX control sequences for Greek letters and special symbols and for sub/superscripts.
Example:
The command below uses textoidl to create a somewhat fancy X label.
IDL > plot, [0], [0], xtitle=textoidl("\rho^2 + 2\Gamma_{ij}")
Greek (Coyote Library)
Another way of inserting greek letters in your plots. The command greek('mu') for example returns a string with the greek letter mu.
Example:
IDL > Plot, [0], [0], XTitle='Wavelength (' + Greek('mu') + 'm)'
Wednesday, January 6, 2010
Gerencie seus artigos com MENDELEY
Olá pessoal,
Venho usando a algum tempo um programa chamado "MENDELEY" para organizar e gerenciar os artigos (em pdf) baixados do ADS, AstroPH, etc. É um programa extremamente útil, inteligente e fácil de usar (e, claro, gratuíto e roda no Linux e em outros OS's). Diria que é "A" ferramenta!
Este programa vem sendo usado cada vez em escala crescente no meio científico e veio preencher
uma lacuna que existia no universo dos aplicativos voltados para pesquisadores. Possivelmente,
nos próximos anos, será uma ferramenta que grande parte dos pesquisadores estará usando.
O intuito desta mensagem é divulgar (para quem não conhece ainda) e incentivar o uso do MENDELEY no DepAstro.
Funciona assim: vc cria um diretório e coloca lá todos os PDFs que baixou (ou gerou) nos últimos 200 anos. Colocará lá também todos os PDFs que baixar (ou gerar) nos próximos 200 anos.
Depois de baixar e instalar o MENDELEY, deve configurá-lo (isso é fácil!) para procurar seus
artigos pdfs neste diretório. Na primeira vez que ele rodar, vai ler cada artigo PDF e extrair automaticamente informações como título, autores, ano de publicação, nome do periódico, página, ref, etc. Tudo isso vai para um banco de dados que vc poderá consultar de modo fácil e prático a qualquer momento. Cada autor, por exemplo, vai para uma lista de autores; depois, basta clicar no nome de um autor para ele listar todos os artigos disponíveis com este autor.
Vc não precisa se preocupar mais com as atualizações de seu banco de dados. Cada novo artigo que baixar da internet, basta jogar nesse diretório e o MENDELEY, automaciamente, se encarregará em incluí-lo em seu banco de dados (ele espia o diretório periodicamente a procura de novidades). Apenas jogue seus pdfs no diretório e deixe o resto com o MENDELEY.
Os artigos podem ser agrupados em CATEGORIAS (através de Tags), definidas pelo usuário.
O programa permite BUSCAS por palavras chaves ou expressões nos textos e muito mais:
ele dispõe de uma CANETA VITURAL MARCADORA DE TEXTO, com a qual vc pode marcar em amarelo partes do texto (como faria com uma caneta marcadora real!).
Também pode inserir POST IT's (aqueles papeis amerelos), virtuais, com seus comentários em diferente partes do texto. Estes recursos são extremamente úteis para REFEREES ou para inserir comentários no artigo de um colaborador (ou em qualquer outro doc pdf, como teses, dissertações, ebooks, etc), ou em um artigo em preparação.
Os recursos do programa não param por aí: vc pode PARTILHAR ARTIGOS através da internet (enviar / receber / acessar) com seus colegas de grupo (e de outras instituições dentro e fora do país) que também usam o MENDELEY. Algo como o velho Napster, LimeWare ou Kaza, só que para artigos. Atualmente (jan/2010) já existe mais de 210 milhões de referências nos bancos de dados dos ~13 mil usuários espalhados pelo mundo. Essa é uma das boas razões para incentivar o uso deste programa em maior escala entre nós. Não vai mais precisar enviar artigos por email.
Outra coisa que ele faz é GERAR BIBLIOGRAFIAS em BiBTeX ou similares a partir de uma
lista de artigos pré-selecionados. Útil para quem está escrevendo um artigo, tese ou dissertação.
Isso é só para citar algumas das habilitades do bicho.
Claro que há deficiências: p.ex, o MENDELEY consegue extrair informações muito bem dos artigos mais recentes (de ~10 anos para cá) que foram gerados diretamente no formato pdf, MAS, se atrapalha todo com artigos mais antigos, que foram escaneados ou convertidos para PDF a partir de algum outro formato (jpg, gif, png, ps, etc). Para estes vc tem que editar as informações manualmente, mas os 1 ou 2 minutos que se gasta fazendo isso são plenamente compensados por todos os benefícios que o programa oferece.
O programa vem sendo continuamente aperfeiçoado e o usuário não precisa se preocupar com
as ATUALIZAÇÕES: elas são feitas automaticamente!
O site para download é: http://www.mendeley.com/
Enjoy it.
Edu
Tuesday, December 1, 2009
Recovering data points using g3data
A very nice free, (GNU GPL) application that can be used for extracting data from graphs is g3data. You can install it in ubuntu by typing:
$ sudo apt-get install g3data
or simply download it from the g3data website http://www.frantz.fi/software/g3data.php
I have used it a few times in the past on graphs of different kind and quality and always obtained good results for the extracted data points using it.
The following picture shows g3data at work on a plot:

When the data are recovered you can store them in a file and use your favorite tool to create a new plot.
$ sudo apt-get install g3data
or simply download it from the g3data website http://www.frantz.fi/software/g3data.php
I have used it a few times in the past on graphs of different kind and quality and always obtained good results for the extracted data points using it.
The following picture shows g3data at work on a plot:

Wednesday, November 11, 2009
Recovering deleted pictures from a memory card
A friend of mine recently deleted by accident around 700 pictures from a memory card in her Sony digital camera. She asked for my help and I thought that it would be an easy task to recover the pictures. I played with different programs aimed at data recovery, some of them tuned specifically for photo recovery. Here is a description of the different programs that I used and the results.
I've got several suggestions from colleagues of recovery software to try in linux and windows. I also found that this list of free data recovery programs at lifehacker was very useful.
This tutorial assumes that the memory card is formatted with the filesystem FAT16 (default filesystem in memory cards). The first thing you need to avoid is to write any data to the device where the deleted files were stored.
You should create an image of the device as soon as possible, in case anything goes wrong. In Linux that is pretty easy. Assuming that the memory card is mounted as /dev/sdb1, you need to issue the command
sudo dd if=/dev/sdb1 of=backupcard.img
I tried the following free software (ordered according to my taste): Recuva (win), recoverjpeg (linux/mac) and PhotoRec (win/linux/mac) (recoverjpeg and PhotoRec are available in Ubuntu via Synaptic). I also tried the commercial alternatives Stellar Phoenix Recovery (win) and Nucleus Kernel FAT (win). The latter two programs gave the same results as the three free programs listed above, so no need to pay for them.
The first program I tried was Recuva. It immediately recovered all the deleted files. Unfortunately most of the recovered pictures were corrupted or broken. By corrupted I mean that the pictures have one or more of the following "features":
recoverjpeg gave the same results as Recuva: restored all the photos, but only ~1/7 of the original files were successfully recovered with no problems.
PhotoRec only recovered the ~1/7 pictures that had no problems, ignoring the other corrupted files.
My conclusion: if you use windows try Recuva. If you are a Linux user, try recoverjpeg. And please check this list of Five best free data recovery tools.
I've got several suggestions from colleagues of recovery software to try in linux and windows. I also found that this list of free data recovery programs at lifehacker was very useful.
This tutorial assumes that the memory card is formatted with the filesystem FAT16 (default filesystem in memory cards). The first thing you need to avoid is to write any data to the device where the deleted files were stored.
You should create an image of the device as soon as possible, in case anything goes wrong. In Linux that is pretty easy. Assuming that the memory card is mounted as /dev/sdb1, you need to issue the command
sudo dd if=/dev/sdb1 of=backupcard.img
I tried the following free software (ordered according to my taste): Recuva (win), recoverjpeg (linux/mac) and PhotoRec (win/linux/mac) (recoverjpeg and PhotoRec are available in Ubuntu via Synaptic). I also tried the commercial alternatives Stellar Phoenix Recovery (win) and Nucleus Kernel FAT (win). The latter two programs gave the same results as the three free programs listed above, so no need to pay for them.
The first program I tried was Recuva. It immediately recovered all the deleted files. Unfortunately most of the recovered pictures were corrupted or broken. By corrupted I mean that the pictures have one or more of the following "features":
- Pictures split in two or more parts
- In between a picture there is part of another photo
- Colors changed
recoverjpeg gave the same results as Recuva: restored all the photos, but only ~1/7 of the original files were successfully recovered with no problems.
PhotoRec only recovered the ~1/7 pictures that had no problems, ignoring the other corrupted files.
My conclusion: if you use windows try Recuva. If you are a Linux user, try recoverjpeg. And please check this list of Five best free data recovery tools.
Friday, October 30, 2009
The International Astronomy Meetings List
This link lists the astronomy meetings that will happen around the world: The International Astronomy Meetings List.
Pretty nice.
Pretty nice.
Monday, October 19, 2009
The IFU wiki
To the IFU people: The Integral Field Spectroscopy Wiki
"Do you currently work with, or are you thinking about applying for
integral field unit (IFU) observations? If so, then the Integral Field
Spectroscopy wiki is for you."
(via AstroBetter)
"Do you currently work with, or are you thinking about applying for
integral field unit (IFU) observations? If so, then the Integral Field
Spectroscopy wiki is for you."
(via AstroBetter)
Making your linux desktop more useful (and prettier)
Here is a list of things that I implemented in my Linux desktop manager (Gnome), and made it more productive and also prettier. By prettier I mean looking more like Mac OS X. So in fact this guide gives suggestions to make your linux desktop become more like Mac OS X.
Disclaimer: Some of the suggestions are suited for Gnome, which is the desktop manager that I use. My distro is Ubuntu.Why do I pick Gnome? Well, because I don't like KDE and because Gnome looks more like Mac OS X.
First of all, you need Compiz to turn on pretty 3D effects. And in order to have compiz working you need decent drivers for your video board, with support for 3D acceleration. I suggest to install the package compizconfig-settings-manager which provides a nice interface for changing the settings of the different compiz plugins.
The compiz plugins that I find most useful are:
Google Desktop for linux is a fantastic desktop search tool. It allows me to open the papers and documents I want incredibly fast, without needing to browse any folder. Just need to press CTRL twice and type the relevant keywords. It is the analogous of Mac's Spotlight.
For quickly opening applications, try Gnome-Do. It is the equivalent of Mac's Quicksilver. Again, no need to browse menus for the application you need. Just call gnome-do and type in the few beginning letters in the name of the program you want to launch.
For to-do lists and reminders, try the Sticky Notes applet that comes built-in with Gnome.
Any other suggestions? Feel free to comment.
Disclaimer: Some of the suggestions are suited for Gnome, which is the desktop manager that I use. My distro is Ubuntu.Why do I pick Gnome? Well, because I don't like KDE and because Gnome looks more like Mac OS X.
First of all, you need Compiz to turn on pretty 3D effects. And in order to have compiz working you need decent drivers for your video board, with support for 3D acceleration. I suggest to install the package compizconfig-settings-manager which provides a nice interface for changing the settings of the different compiz plugins.
The compiz plugins that I find most useful are:
- Desktop Wall, for switching between virtual desktops or viewports
- Expo, which shows a snapshot of all desktops at once, similarly to Mac's Spaces
- Scale provides the same functionality as Mac's Exposé
Google Desktop for linux is a fantastic desktop search tool. It allows me to open the papers and documents I want incredibly fast, without needing to browse any folder. Just need to press CTRL twice and type the relevant keywords. It is the analogous of Mac's Spotlight.
For quickly opening applications, try Gnome-Do. It is the equivalent of Mac's Quicksilver. Again, no need to browse menus for the application you need. Just call gnome-do and type in the few beginning letters in the name of the program you want to launch.
For to-do lists and reminders, try the Sticky Notes applet that comes built-in with Gnome.
Any other suggestions? Feel free to comment.
Thursday, October 15, 2009
Tutoriais sobre linux
Este post contém um material que enviei para algumas pessoas que estão iniciando no uso do linux. Pode ser útil aos usuários iniciantes.
Alguns comandos muito úteis no terminal do linux
TAB auto-completa comandos ou nomes de arquivos/diretórios
~ apelido para o caminho da tua home (exemplo: "cd ~" volta para a home)
whatis comando explica sucintamente pra que serve o comando
man comando manual do comando
whereis comando caminho onde está o programa responsável por comando
pwd mostra o caminho completo do diretório corrente
Tabelas de consulta rápida aos comandos
Printable beginner's guide to the terminal
Practical reference of linux commands
Páginas de referência (mais longas)
Guia Foca de Linux
Ubuntu pocket guide and reference (livro completo, grátis)
Linux tutorial for beginners
Alguém tem sugestões sobre bons livros para usuários iniciantes do linux/ubuntu? Escrevam nos comentários.
Monday, October 12, 2009
Programas equivalentes: linux e windows
Pessoal,
Achei este link que traz um post muito legal discutindo programas equivalentes em linux e windows.
Isso será útil para novos usuário.
Achei este link que traz um post muito legal discutindo programas equivalentes em linux e windows.
Isso será útil para novos usuário.
Monday, October 5, 2009
TexMaker
Estive com problemas no uso do kile (editor de latex) no gnome. Uma boa alternativa é o texmaker, que roda muito bem no gnome e tem funcionalidades similares as do kile.
IDL for astronomers
I found an interesting blog entry that summarizes the basics of IDL for scientists. I personally think that IDL is much superior, regarding its resources for data analysis and plotting, than programs like Supermongo, Xmgrace (and its flavors), gnuplot and even Origin. The shortcoming is that IDL is not free and quite expensive, but you get what you pay for. I am curious though to learn how Python, supplemented with additional libraries, compares to IDL in this respect.
If you want to learn more about IDL, google for "idl tutorials" and check this guide of IDL for astronomers. The documentation (tutorials) included with IDL are also a nice way to start learning.
In addition, there are some pretty useful IDL libraries for astronomy that I listed.
Nota: a partir de agora vou passar a escrever alguns dos meus posts em inglês. Assim, algumas das informações compartilhadas neste blog poderão ser de utilidade a uma comunidade mais ampla.
Saturday, October 3, 2009
Solved: Gemini PIT does not work in Ubuntu Linux (recent versions)
Some people noticed that the Gemini PIT (phase I tool) does not work well with some of the most recent versions of Ubuntu linux. What happens: you try to run PIT, but is welcomed by a blank window.
I found out that this problem happens because PIT is not compatible with the resource Compiz available in the most recent versions of linux. The goal of compiz is to make your desktop prettier, looking more like a Mac OS X. The solution is to temporarily disable compiz while you have to submit your observation proposal using PIT.
To temporarily disable compiz, there are two ways that occur to me:
1. In Gnome: System -> preferences -> appearance -> visual effects, set none.
2. Use the program Compiz-switch, which is what I did.
The same trick also works for the Observing Tool (Gemini OT) program.
Wednesday, September 30, 2009
Solucionado: Gemini PIT não funciona no Ubuntu Linux (versões mais recentes)
Algumas pessoas que estão encaminhando pedidos de tempo com o Gemini notaram que o Gemini PIT (phase I tool) não se entende bem com as versões mais recentes do Ubuntu. O que acontece: você tenta rodar o PIT, mas é agraciado com uma janela em branco.
Descobri que este problema ocorre pois o PIT é incompatível com o recurso Compiz presente nas versões mais recentes do linux, que serve pra deixar o sistema mais bonito. A solução é desativar temporariamente o compiz enquanto você tem que usar o PIT.
Pra desativar temporariamente o compiz há duas maneiras que me ocorrem:
1. No Gnome: System -> preferences -> appearance -> visual effects e botar none.
2. Usar o programa Compiz-switch, que foi o que eu fiz.
Tuesday, September 29, 2009
Como salvar a lista de pacotes no ubuntu e usar ela para re-instalação posterior.
Várias vezes passamos pelo problema de querer ter duas máquinas com a mesma instalação do linux (ubuntu, no caso) ou de simplesmente recuperar a instalação padrão anterior.
Para isso rode o comando:
sudo dpkg --get-selections | grep -v deinstall > packagelist
Esse comando salvará o nome de todos os pacotes instalados no arquivo packagelist.
Depois abra o synaptic, com o comando:
sudo synaptic
Agora, vá em file depois em read markings e selecione o arquivo packagelist e pronto, é só clicar em instalar.
Espero que estas dicas sejam úteis.
Segue abaixo uma descrição do problema e de soluções "alternativas" a esta.
fonte: http://www.inportb.com/wp/
___________________________________________________________________
HOW TO: on Ubuntu, save the package list and use it to
reinstall packages later
(This tutorial will work for any Debian-based system,
including Ubuntu.)
Have you ever wanted to save a list of software
installed on a Debian box and reinstall the same
packages after reinstalling Debian? Have you ever
wanted to install on a Debian box the same software
you have installed on another Debian box? I've
recently had to reinstall my system from scratch, and
the following may help you as well.
(This is also posted on my blog at
http://www.inportb.com/wp/)
Generate the Package List
Let's first save the current package selection states:
Quote
$ dpkg --get-selections | grep -v deinstall > packagelist
Now we have a compact list of installed packages in a
file called "packagelist". Let's store this so that we
could retrieve it from our other Debian installation.
Or we could email it to ourselves using mailx:
Quote
$ cat packagelist | mailx -s "packagelist" user@example.com
Reinstall the Packages
To restore our packages, let's first restore the
package selection states:
Quote
$ sudo apt-get update
$ sudo apt-get dist-upgrade
$ sudo dpkg --set-selections < packagelist
Now let's actually install it all:
Quote
$ sudo apt-get -u dselect-upgrade
Restore the System
What if we wanted to restore our system to an earlier
state by installing everything that's on our list and
uninstalling everything that's not? We can do that
too, but we need to be careful because this may entail
a radical change. Before restoring our package
selection states, we're going to deselect every
package, thereby marking them for uninstallation:
Quote
$ sudo dpkg --clear-selections
$ sudo dpkg --set-selections < packagelist
Now, every package not on our list has been deselected
and everything on our list has been selected. Let's
commit the changes:
Quote
$ sudo apt-get -u dselect-upgrade
If we wanted to remove the configuration files of the
uninstalled packages, we'd do the following instead:
Quote
$ sudo apt-get -u dselect-upgrade --purge
Please don't forget to restore the package selection
states before running apt-get, or the whole system
would be uninstalled!
Subscribe to:
Posts (Atom)

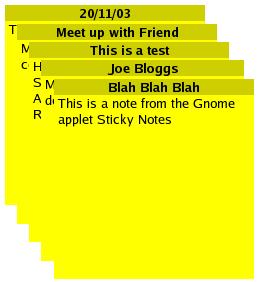